This page was generated from
docs\source\examples/grids2d.ipynb.
Grid generation in 2d#
[2]:
from sigmaepsilon.mesh import PolyData, PointData, CartesianFrame, grid
from sigmaepsilon.mesh.cells import Q4 as CellData
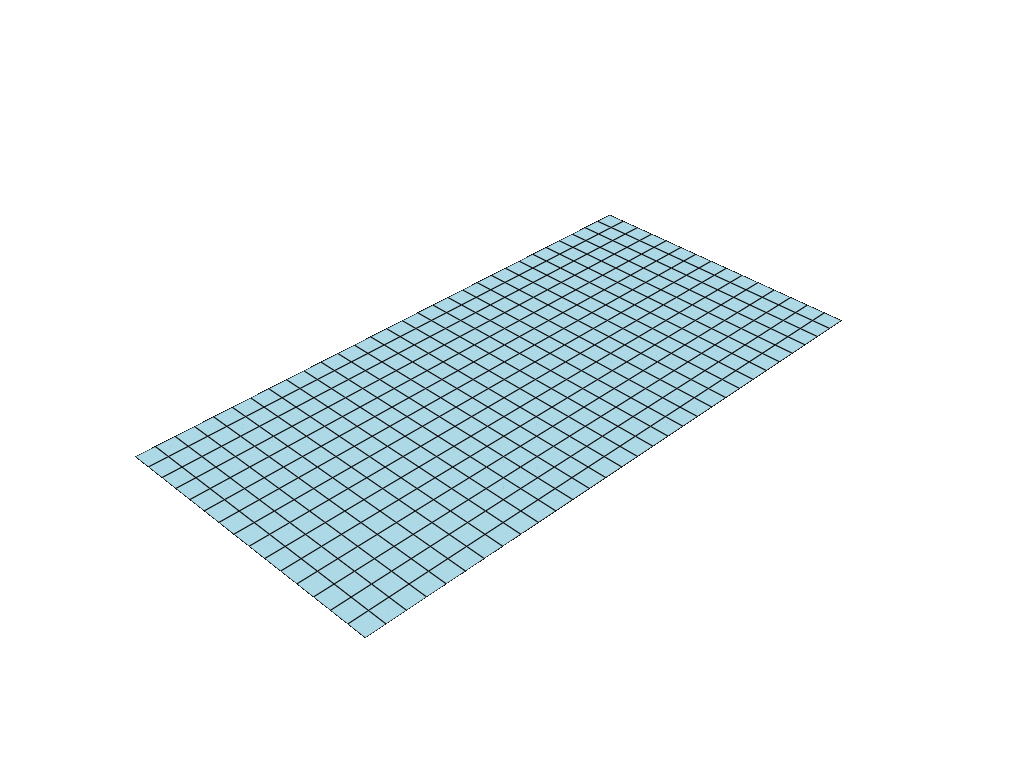
# create a grid of 30 x 15 cells, with 2 x 2 nodes per cell
gridparams = {
"size": (1200, 600),
"shape": (30, 15),
"eshape": (2, 2),
"path": [0, 2, 3, 1]
}
coords, topo = grid(**gridparams)
frame = CartesianFrame(dim=3)
pd = PointData(coords=coords, frame=frame)
cd = CellData(topo=topo, frames=frame)
mesh = PolyData(pd, cd)
mesh.plot(notebook=True, jupyter_backend="static", theme="document")